For retail customer insights in the specialty retail space (think home improvement, pet care, etc.), we turned to the data. Specifically, using InMobi’s real-time mobile audience insights, we wanted to see who had these kinds of apps on their mobile devices in the U.S. and how net app install trends have evolved of late.
For this analysis, we looked at app customer data for the following brands: Best Buy, CVS, The Home Depot, Kroger, Lowe’s, Sephora and Walgreens. In reviewing their major retail apps, what kinds of actionable insights could we glean?
Here’s what we found.
Top Takeaways
- Year-over-year net app installs began to decline by April and May 2021, with consumers seeming to move away from directly using apps in favor of other buying methods, such as in-person shopping.
- Outside of The Home Depot and Walgreens, most specialty retail apps were seeing flat app adoption by May and June 2021.
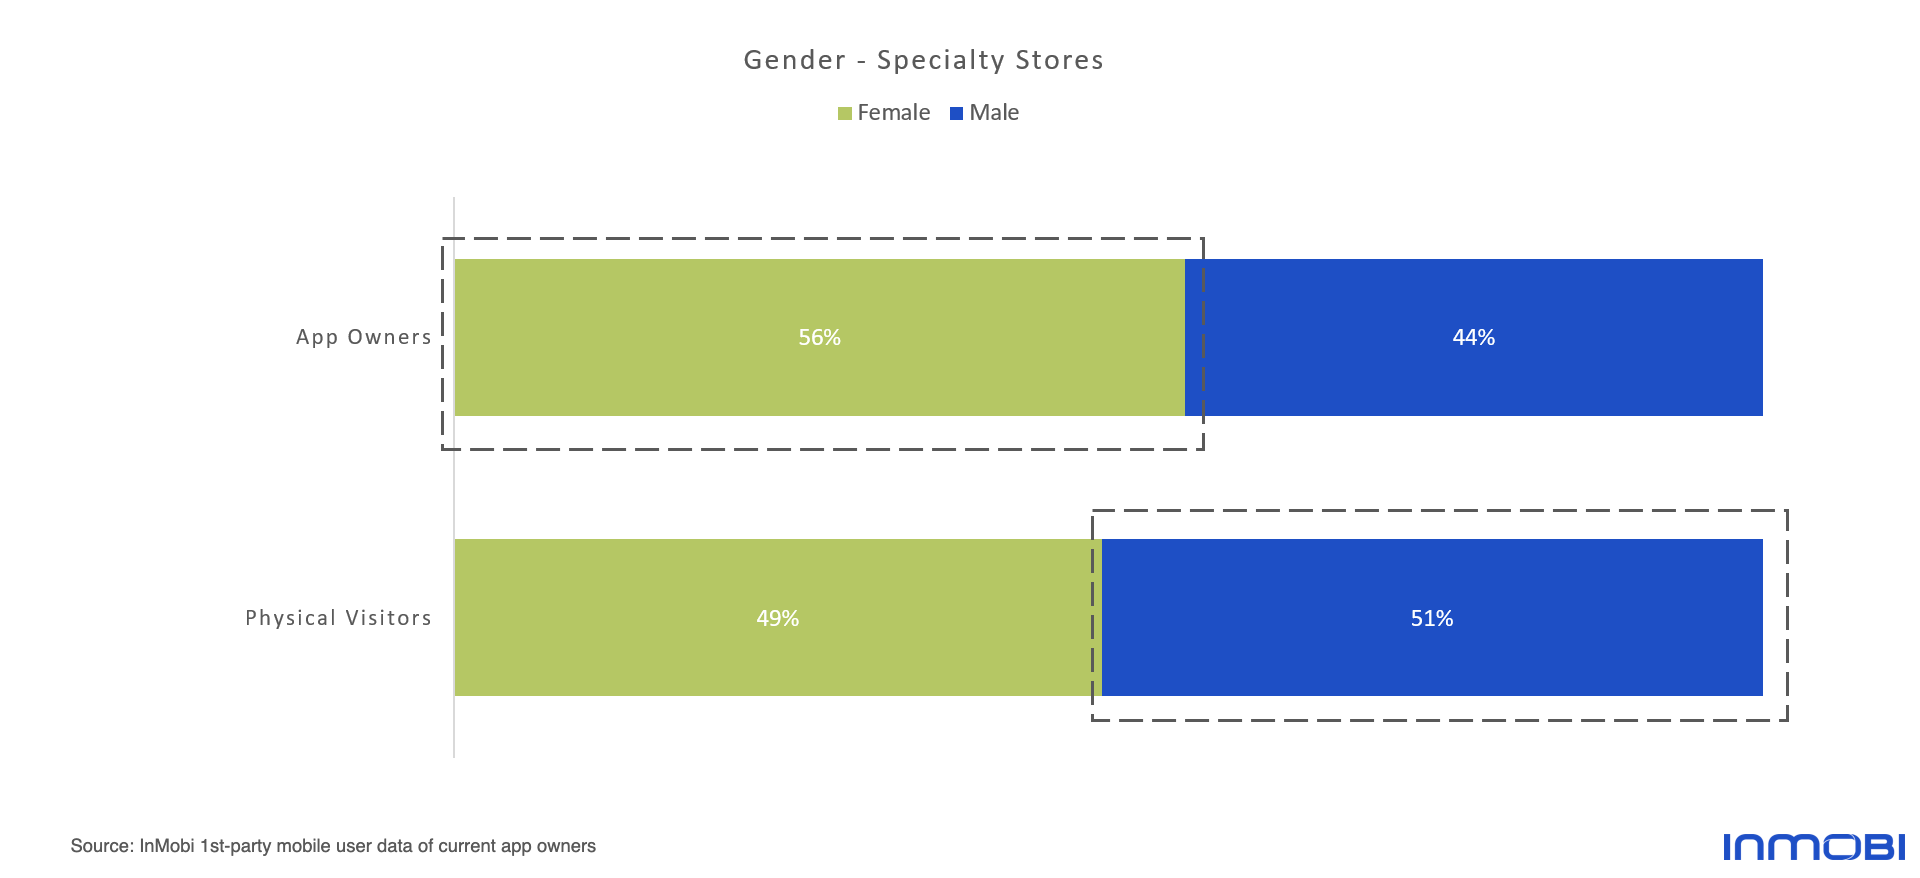
- While 56% of specialty app owners are female, 51% of those visiting their physical storefronts are male.
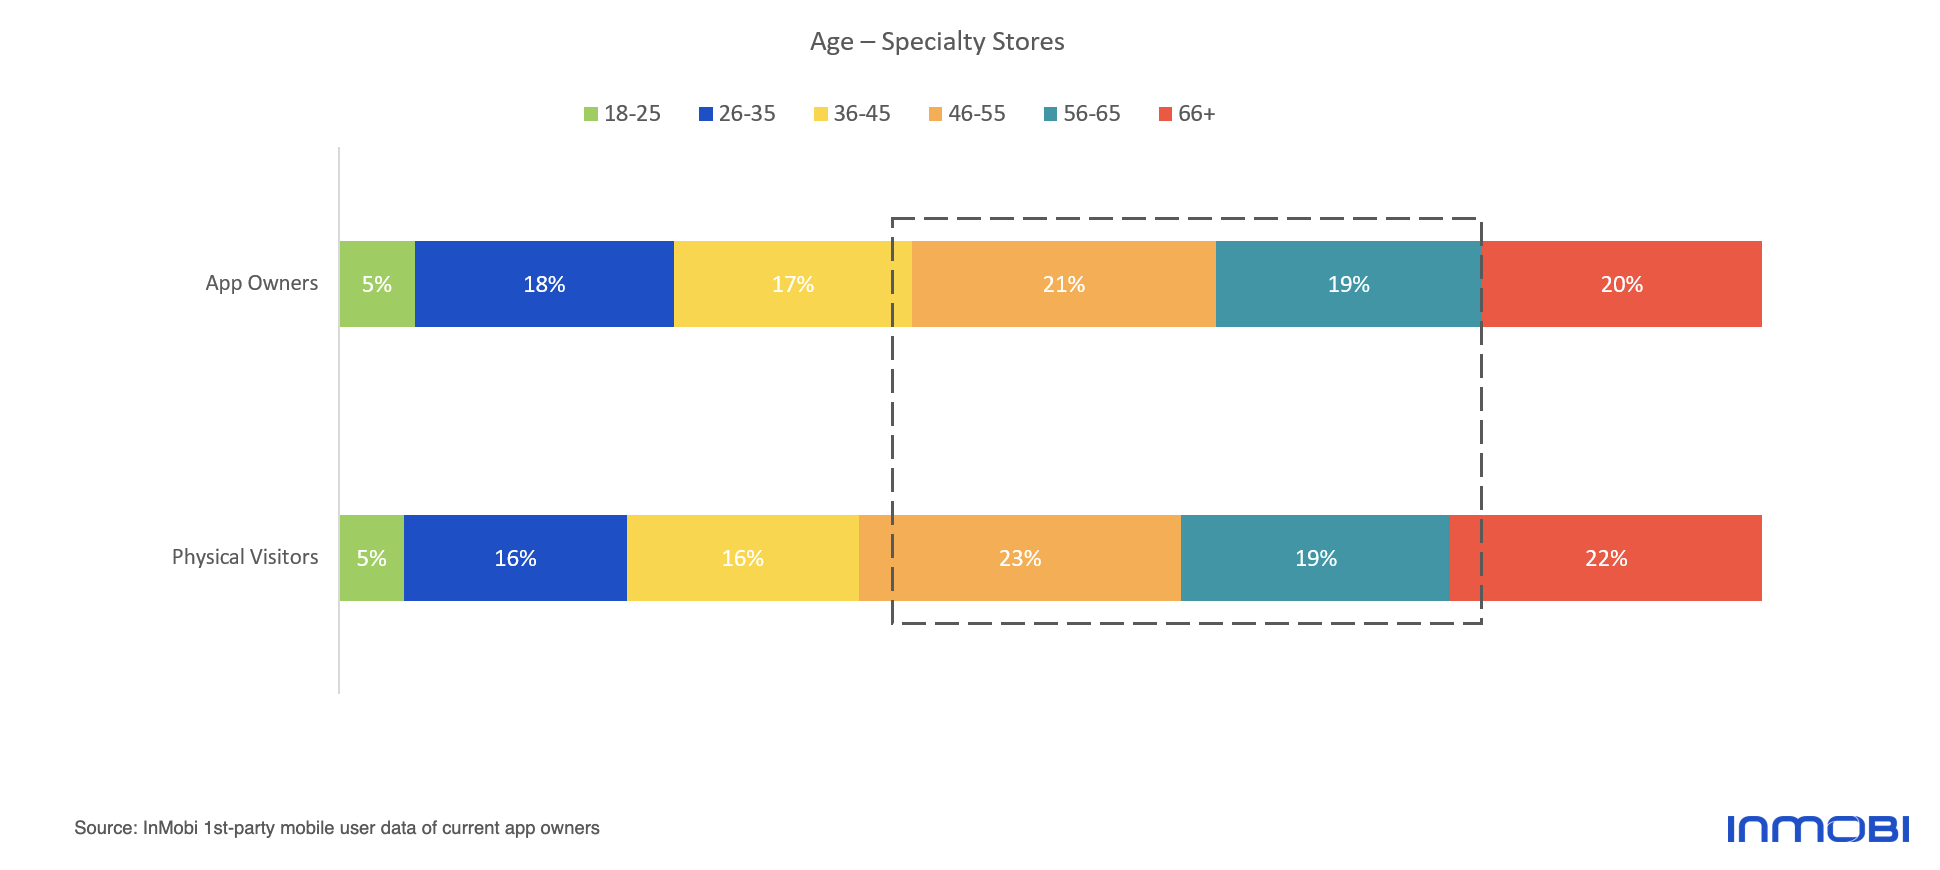
- 40% of app owners and 42% of physical store visitors are between 46 and 65 years old.
How The Reopening of Brick and Mortar Retail Impacts App Installs
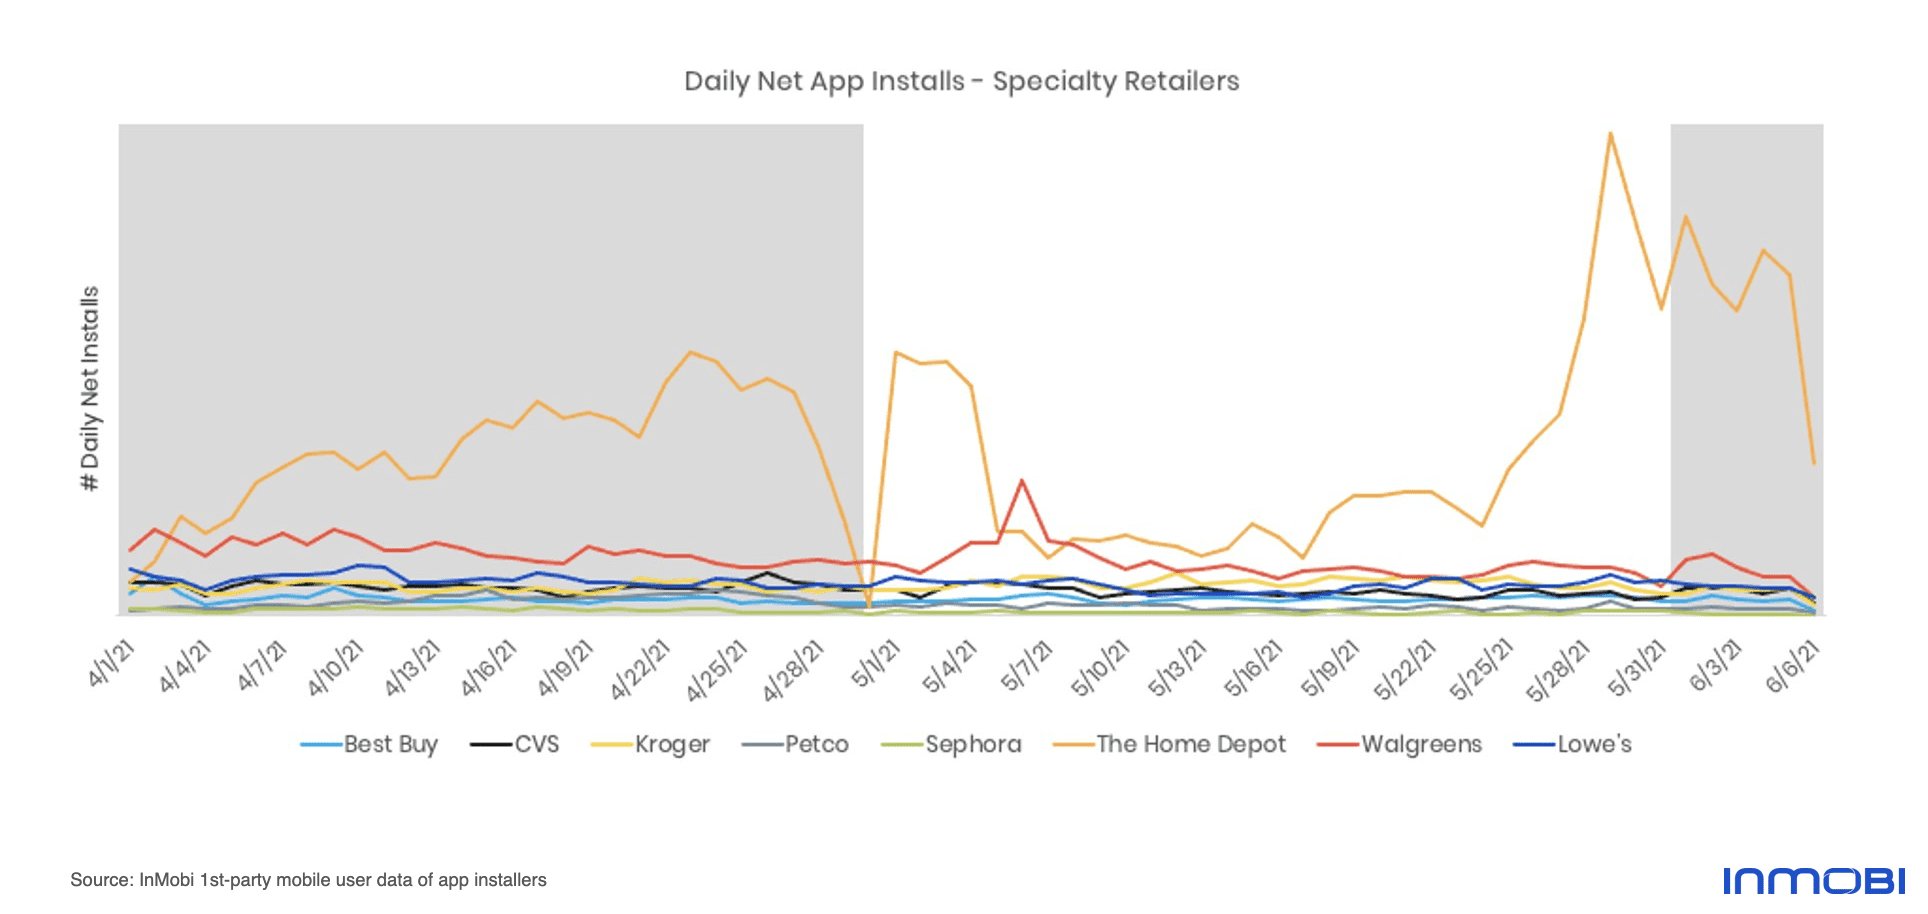
In looking at year-over-year app install trends in this space, this customer segment overall has been quick to shift from apps to in-person shopping. Take a look at how net app installs have fluctuated throughout the first few months of 2021.
| Month |
YoY Change in Net App Installs |
| January |
66% |
| February |
45% |
| March |
28% |
| April |
0% |
| May |
-5% |
It’s not necessarily the case that customer loyalty is dropping – in fact, InMobi Pulse research from earlier in 2021 found that 27% of consumers plan on shopping with at least one specialty retailer (either online and/or in person) between May and October 2021. Rather, this data shows that as consumers gain greater choice in how they shop, their customer journey is leading to physical storefronts, not apps. What’s happening here? As Covid restrictions in the U.S. are eased and as more Americans become vaccinated, this customer segment is embracing in-person shopping at the expense of shopping using the brand’s own app. This aligns with earlier research we conducted, which found that 74% of adults in the U.S. were already making purchases in person by May 2021.
And, of course, different retailers are seeing different trends. For example, The Home Depot had seen a spike in net app installs on and after Memorial Day, while Walgreens saw a jump in early May. But outside of those two, net app installs for most of the specialty brands we surveyed are largely flat of late.
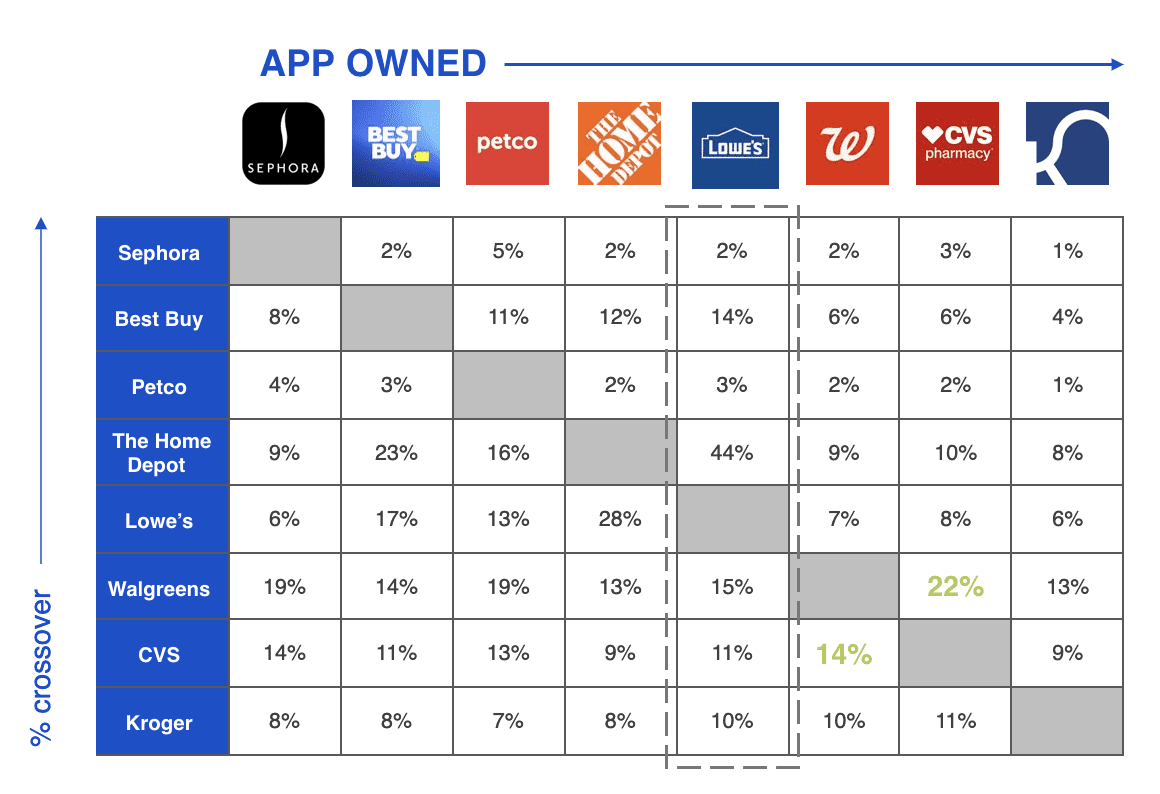
It makes sense that different brands are seeing different net app install trends, as these specialty retailers are quite diverse in their offerings. Across many of these brands, there is little overlap in terms of audience. For example, just 1% of Kroger app owners also have the Petco app, while only 2% of those with the Lowe’s app have the Sephora app on their mobile device too.
Should The Specialty Retail Customer Experience Include Apps?
Seeing these trends begs the question: do specialty retailers need apps? After all, if consumers are happy to shop in person, then is having and investing in an app a worthwhile investment?
While in-store footfall is always ideal, this data shows that many specialty retailers are not taking full advantage of their apps. Consider these statistics:
- Someone with a retail brand’s app is 19% more likely to visit their brick-and-mortar location compared to non-app owners.
- In looking at those who engage with a brand on mobile, average daily sessions per user for those with the brand’s app was 6% higher than for those who didn’t have the brand’s app.
- 86% of consumers say their loyalty to a brand increases when their mobile app provides them with features they love.
- Mobile apps are not an either/or proposition. The best retail brands can leverage their own apps as part of a successful, holistic omnichannel selling strategy.
Who Owns Specialty Retail Apps?
While net app installs in this category may be largely flat or on the decline of late, these brands nevertheless have huge followings, including on mobile. Who currently has these retail apps on their mobile devices, and how do mobile app audiences compare to those who are shopping with these retailers in person?
Interestingly, there’s a gap between these two audiences in terms of gender. While 56% of specialty app owners are female, 51% of those visiting their physical storefronts are male.
In terms of age, however, there’s more overlap. Overall, 40% of app owners and 42% of physical store visitors are between 46 and 65 years old.
How Specialty Retailers Should Think About Mobile
Of course, whether or not retailers are heavily investing in their own apps, mobile should still play a key role in their overall marketing and outreach efforts. After all, Americans spend more time with mobile than with any other single media source.
Considering the always-on and always-available nature of mobile, it’s now an ideal way to reach and engage with customers no matter where they are. Mobile is an ideal option for reaching people between 46 and 65 years old too, which is clearly a major audience for specialty retailers!
Mobile advertising is highly effective too. According to InMobi Pulse research, 53% of Americans have said they discover new products through mobile ads.
Mobile advertising is a great way to drive footfall too. Of all the people who are exposed to a typical location-based mobile ad campaign, around 66% of them will later make a purchase with that brand. Plus, people who see a location-based mobile ad and actually visit a brick-and-mortar location are 25% more likely than others to make an e-commerce purchase with that brand.
Interested in getting started with mobile advertising? Reach out today to speak with one of InMobi’s mobile experts.
What are your thoughts on this data? Let us know on social media! You can reach out to us on LinkedIn, Twitter, Facebook or Instagram.


![How Mobile is Used In The Modern Shopping Journey [Infographic]](https://go.inmobi.net/hubfs/Retail%20Infographic%20Header3.png)