Fuel campaign performance with laser-focused targeting


As you may remember InMobi acquired Appsumer, the performance insights platform for mobile app advertisers, in October 2021. Appsumer has been working closely with mobile performance advertisers to build the optimum measurement infrastructure for the new privacy era we are currently experiencing in mobile advertising.
As part of that work they have just published this new eBook, “Apple’s privacy changes one year on: The good, the bad and the solutions.” You can download that eBook for free here. When producing this eBook they also looked at the aggregate spend data that flows through their platform across multiple channels to understand how different advertisers are spending in a post-App Tracking Transparency (ATT) world.
The key finding was interesting and we just wanted to summarize that here and look at some of the possible explanations.
Before jumping into the data, it’s important to set the context of the data we’re looking at. So here are a few key points:
With that understood, let’s take a look at the key finding. Within the dataset Appsumer found that the key to maintaining pre-ATT iOS spend share has likely been the size of advertiser investment.
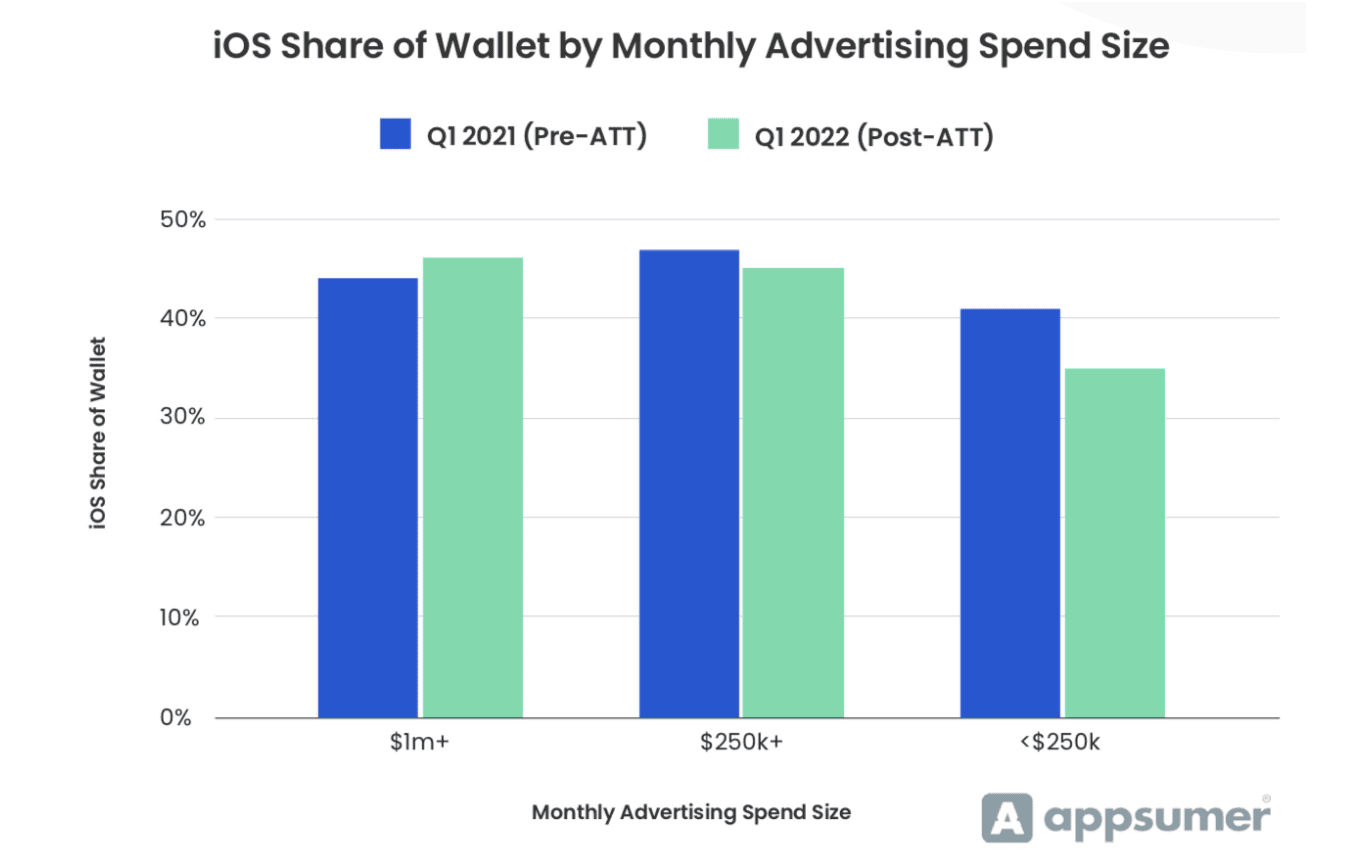
Importantly, the largest advertisers spending greater than $1 million per month on mobile app install advertising have surprisingly increased their share of spend that goes towards iOS from 44% pre-ATT to 46% post-ATT. Meanwhile, the mid-tier of advertisers spending $250,000 to $1 million per month have seen a marginal reduction in the share of iOS spend from 47% to 45%. However, advertisers in Appsumer’s base spending under $250,000 per month have seen the most significant drop in iOS share of spend, as it fell from 41% to 35%.
The suggestion from this data is that larger, more sophisticated advertisers have been able to maintain or even increase their iOS spend a year after ATT was launched. Meanwhile, lesser resourced advertisers have struggled to spend on iOS in a post-ATT world.
You may remember back to Facebook’s initial PR messaging that suggested Apple’s ATT move would have the biggest negative impact on smaller businesses. If this data is anything to go by it appears that their projections were correct when it comes to certain consumer mobile apps. However, the smallest of consumer mobile apps haven’t been picked up in this study, so the impact could be even more severe for them.
Why are advertisers spending less than $250,000 a month struggling the most with iOS, while larger advertisers are finding opportunity? We’ll explore some possible explanations below.
A large part of it could be to do with sophistication, particularly around the measurement infrastructures they’ve built. With a bigger set of resources, the largest advertisers have been able to quickly build a measurement infrastructure around Apple’s privacy preserving SKAdNetwork (SKAN) attribution solution in a few key areas:
Ultimately, larger advertisers more rapidly developed an effective measurement infrastructure around SKAN and can likely better prove the value of iOS investments to maintain or even increase their investment levels.
Another big challenge we see with SKAN is Apple’s mysterious privacy threshold. This is a mechanism that returns a “NULL” Conversion Value and source app details when a specific volume of installs isn’t met for a campaign.
It’s mysterious, because Apple doesn’t reveal what that volume of installs is per a campaign. Facebook has said that on their platform you require 128 installs per campaign per day to avoid falling foul of the privacy threshold.
However, investigations at Appsumer suggest that the privacy threshold is between 10-20 installs per day per SKAN Campaign ID. The reason it’s higher for Facebook is that they don’t have a one-on-one relationship between their campaigns and SKAN Campaign IDs as they use extra Campaign ID’s for their own learning.
The significance is that Facebook is making the privacy threshold higher because they need to run short-term learning and experimentation on their targeting algorithm to benefit long-term performance. As such, advertisers might see a reduced impact of the privacy threshold when testing alternative channels in the short-term.
A huge challenge, particularly for smaller advertisers, is not being able to prove the value of iOS 14.5+ campaigns because at the scale they operate a high percentage of their campaigns are returned with no information about install value and source due to low volumes. A big part of this is that smaller advertisers largely invest on three core channels, including nearly always Facebook.
As we’ve highlighted, the bar to overcome the privacy threshold for Facebook campaigns is higher than elsewhere. This means that getting reliable performance data on iOS Facebook campaigns could be a bigger challenge for smaller advertisers and consequently they have had to scale back spend.
As we touched on, Appsumer’s last benchmark report found that smaller advertisers use on average three channels, mid-size advertisers five channels and large advertisers 12 channels.
For smaller advertisers this three channel mix is typically made up of Facebook, Google and either Apple Search Ads (ASA) or a DSP. The difficulty of performance and measuring it were impacted differently across various channels on iOS by ATT.
For example, Facebook was quite transparent about the performance and measurement challenges they faced. Meanwhile, some other channels have seen a much reduced impact due to their targeting mechanisms and lesser impact of the privacy threshold.
This meant that if your iOS channel mix was more diverse then continuing to maintain spend on iOS was easier, if more complex. Mobile Growth Consultant Matej Lancaric recently shared some thoughts about this on an episode of Shamanth Rao’s Mobile User Acquisition Show:
“These days, everything is changing so rapidly. Last year, I sometimes felt like I was riding a roller coaster! There were times when Facebook was doing well, and then the quality decreased—everything was changing. So if you put all your eggs in one UA basket, you are playing a very dangerous game, I would say. If you’re running your UA on one channel and that’s the only channel, what if that stops working?”
Later Shamanth Rao asks Matej when a game is out of soft launch at what scale of spend he looks to diversify the channel mix in a post-ATT world? His response reveals a much evolved approach:
“If we were having this discussion three years ago, I would say Facebook only, up until you hit around $1 million a month in spend. But things have changed quite rapidly. I start thinking about diversifying the UA portfolio after hitting like $20,000 a month.”
Ultimately, advertisers without six-figure ad budgets might be struggling to spend on iOS in a post-ATT world because their channel mix was less diversified as they went into ATT.
We don’t have space to go in-depth on the right solutions for advertisers here. However, Appsumer has taken its experience from working with some of the largest advertisers to highlight solutions for lesser developed advertisers in their latest eBook, covering:
To get access to these insights you can get your free copy of their eBook - “Apple’s privacy changes one year on: The good, the bad and the solutions” here.


Register to our blog updates newsletter to receive the latest content in your inbox.


![In-App Ads.txt: What You Need to Know [VIDEO]](https://web.inmobicdn.net/website/website/6.0.1/uploads/blog/app-ads.txt_video_blog_about_image.png)