Fuel campaign performance with laser-focused targeting


As we’ve noted in our earlier post, people who live in Red states (areas more likely to vote for Republican politicians) use their mobile devices a little differently than people who live in Blue states (areas more likely to vote for Democratic politicians).
We wanted to dig in on this a little further to see if we could identify similar trends on a city-by-city level. Especially in key swing states, how certain counties and cities vote could very well determine whether a state is Red or Blue come election day this year.
Here’s what we found.
First, a note on the data we used. All insights stemmed from InMobi’s various first-party, mobile-first data sources, which stem from our wide SDK footprint from InMobi Exchange along with data from our own mobile properties. We specifically looked at both app ownership and mobile engagement (as measures through mobile website sessions).
We looked at cities in Red states (specifically Texas), Blue states (California and Colorado) and swing states (Arizona, Florida and Virginia). In each state, we analyzed one city that has historically supported Republican candidates in the last few years and one that tends to vote more for Democrats.
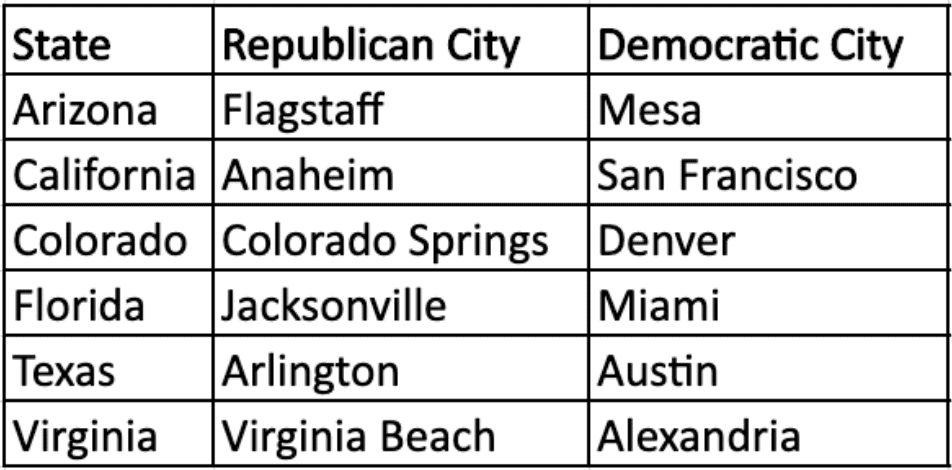
To further confirm just how each of these cities are leaning politically, we looked at three key categories: news consumption, religion/Bible consumption and NASCAR fandom. On the news side, cities that consume Fox News over NPR or CNN we consider to be more Republican-leaning, while the opposite is true for Democratic cities. In addition, the more likely a city’s residents are to consume Bible and NASCAR content, the more Republican we would consider them to be for our analysis.
Based on our mobile analysis criteria, most of the cities aligned with our initial expectations. Flagstaff, Colorado Springs, Jacksonville and Virgina Beach do indeed exhibit Republican mobile usage patterns, while all the Democratic cities do have Blue state mobile usage behavior.
But there were two interesting outliers in Anaheim and Arlington. In particular, NASCAR and Bible content is not very popular in either place, although in each city there is a slight preference for Fox News over the other news sources we used for our analysis.
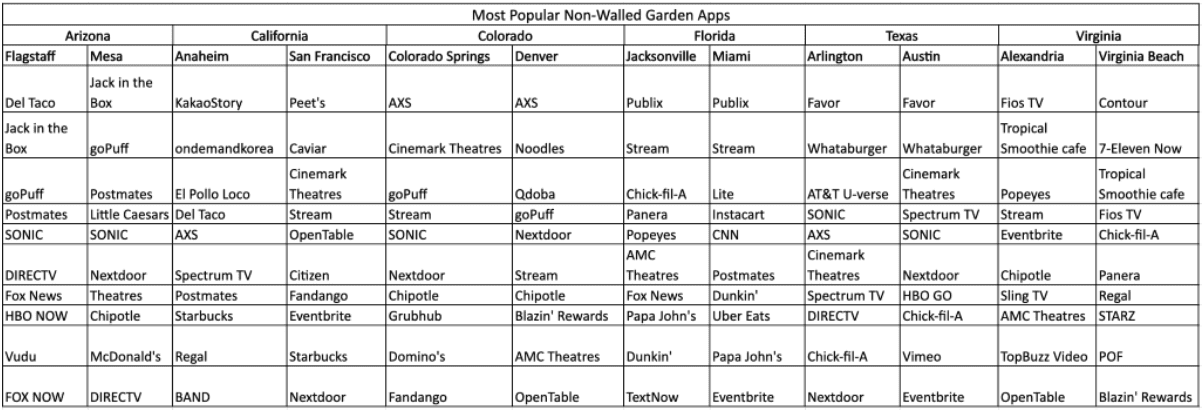
One thing that really stuck out to us was the extent to which app usage and ownership differed drastically by state. Overall, the two cities in each state were more likely to have similar app ownership trends, while cities in different states that may vote for the same political party were unlikely to have the same apps.
Colorado Springs and Denver are a good example of this paradigm. While each location is firmly on the opposite end of the current political spectrum, there is a lot of overlap in app ownership trends. For example, a person in Colorado Springs is more likely to have same apps as a person in Denver as compared to a person in Flagstaff or Viriginia Beach.
For political advertisers, there are a few key takeaways from this city-by-city analysis. For one, it really hammers home the necessity of local targeting. Especially in swing states like Florida, it’s key to reach intended audiences with customized messaging that resonates with them and the issues relevant to that particular part of the country.
It also helps to highlight how even though each side can count on millions of supporters across the country, there are a lot of nuances in different locations. As our analysis shows, interests can vary dramatically by location.
For political advertisers, it’s imperative to understand which apps are used in specific locations and why. After all it’s possible to target likely voters through many of these properties.
This data further goes to show the lack of homogeneity even in solid Blue states or solid Red states. For example, Colorado may go for Democratic candidates these days, but that doesn’t mean that Republican donors and supporters can’t be found in the state.
Even for non-political advertisers, this is a useful exercise. This analysis further underscores the benefits of geotargeting, highlighting the necessity of understanding consumer trends and preferences on the ground and how they can vary even within the same state.
Interested in learning more about our data sources? Reach out today to see for yourself how InMobi’s data and audiences expertise can help your ad campaigns win big.
Matthew Kaplan has over a decade of digital marketing experience, working to support the content goals of the world’s biggest B2B and B2C brands. He is a passionate app user and evangelist, working to support diverse marketing campaigns across devices. He also previously covered politics and government for the Daily News Tribune.


Register to our blog updates newsletter to receive the latest content in your inbox.


![In-App Ads.txt: What You Need to Know [VIDEO]](https://web.inmobicdn.net/website/website/6.0.1/uploads/blog/app-ads.txt_video_blog_about_image.png)


